All published articles of this journal are available on ScienceDirect.

Biotechnological Assessment of SLC47A2 Genetic Variations and Glycemic Control in Diabetes Mellitus
Abstract
Introduction
Type 2 Diabetes Mellitus (T2DM) is a multifactorial metabolic disorder influenced by genetic and environmental factors. Glycemic Control (GC) plays a key role in preventing diabetes-related complications. Variations in drug transporter genes such as SLC47A2 may contribute to differences in GC among patients receiving metformin therapy.
Methods
A cross-sectional study was conducted on 120 T2DM patients receiving metformin monotherapy. GC was evaluated using Fasting Blood Glucose (FBG), HbA1c%, insulin levels, HOMA-IR, and insulin sensitivity indices. Participants were categorized into good and poor GC groups based on ADA criteria. Six SLC47A2 SNPs (rs553096515, rs566505112, rs535426224, rs557659793, rs183037055, rs540311235) were genotyped using PCR and DNA sequencing. Statistical analyses included allele/genotype frequencies, Hardy–Weinberg Equilibrium (HWE), Linkage Disequilibrium (LD), haplotype structure, and SNP–SNP interaction.
Results
Overall, 55% of participants had poor GC. FBG and HbA1c% were significantly higher in the poor GC group (p < 0.05). Novel alleles were identified in three SNPs. No significant associations were found between any of the six SNPs and GC status. Most SNPs showed significant deviations from HWE. LD analysis demonstrated a strong linkage among rs553096515, rs566505112, and rs535426224 in both GC groups.
Discussion
Although multiple SLC47A2 variants and novel alleles were detected, none showed a significant relationship with GC. Strong LD among selected SNPs suggests possible shared genetic patterns, yet without an impact on glycemic status. Factors beyond SLC47A2 variation may play more influential roles in determining GC among Iraqi T2DM patients.
Conclusion
SLC47A2 gene variants were not significantly associated with glycemic control in T2DM patients treated with metformin. Broader genetic assessments and larger sample sizes are recommended for future research.
1. INTRODUCTION
Diabetes Mellitus (DM) is a very common public health problem and a significant burden of disease [1]. Type 2 Diabetes Mellitus (T2DM) is the most prevalent metabolic disorder, characterized by impaired insulin function [2]. About 463 million cases of DM were estimated in 2019, and this number is expected to increase to 578 million by 2030 and 700 million by 2045 [3]. T2DM is characterized by beta-pancreatic cell failure and peripheral insulin resistance [4]. It accounts for approximately 90–95% of all DM cases. Despite global efforts by the healthcare community, its prevalence and incidence continue to rise [5]. Glucose Control (GC) is a risk factor in DM that can lead to complications, and new approaches for assessing GC are still under evaluation.
The main treatment goal is to maintain regular glycemic biomarkers in DM patients to prevent microvascular and macrovascular complications [1]. Glucose control (GC) is represented by optimal blood sugar levels [6] and is evaluated using three parameters: Fasting Blood Glucose (FBG), HbA1c%, and postprandial glucose. Among these, HbA1c% is the primary biomarker for GC evaluation [7]. According to the American Diabetes Association (ADA), good GC in DM patients is defined as an HbA1c of ≤7% and FBG of 70–130 mg/dL, while the American College of Endocrinologists (ACE) recommends a cutoff of HbA1c ≤6.5% and FBG of 3.9–7.2 mmol/L [3, 4, 8]. Poor glycemic control leads to complications, reduces quality of life and life expectancy, and increases healthcare costs associated with the disease [9-12].
Although GC is important, it has been observed to be suboptimal due to multiple contributing factors [13], which limits the ability of healthcare institutions to implement appropriate interventions for improving GC [14].
Solute Carrier Family 47 Member 2 (SLC47A2), also known as Multidrug and Toxin Extrusion 2 (MATE2), encodes a protein belonging to the transporter family involved in the excretion of toxic electrolytes. This gene is one of the MATE transporter family members located on chromosome 17 and is implicated in the transfer of endogenous physiological amino compounds [15]. SLC47A2 may mediate the transport and excretion of metformin [16]. Alternatively spliced transcript variants encoding different isoforms have also been detected for this gene [16, 17]. Considering the poor GC observed in some T2DM patients among Iraqi individuals, the present study aims to investigate the genetic variation of SLC47A2 and its association with glycemic control in T2DM.
2. MATERIALS AND METHODS
Study Subjects and Sample Collection: The present cross-sectional study included 120 cases diagnosed with T2DM. Blood samples were collected for the assessment of glycemic parameters and DNA extraction to achieve the study objectives. Clinical and demographic data, including sex, age, Body Mass Index (BMI), and disease duration, were obtained from each participant after written informed consent, in accordance with the ethical principles of the Declaration of Helsinki and approval from the Ministry of Higher Education and Scientific Research in Iraq. All participants were on a single oral anti-diabetic medication (metformin). Based on the American Diabetes Association (ADA) criteria, participants were categorized into two groups: good GC, defined as HbA1c ≤ 7%, and poor GC, defined as HbA1c > 7%.
The inclusion criteria comprised cases diagnosed with T2DM, all of whom were receiving a single type of oral anti-diabetic medication.
Exclusion criteria included cases with coexisting chronic illnesses like viral infections (including COVID-19), kidney disease, liver disease, or any form of malignancy. Cases receiving insulin therapy or other medications known to influence glycemic control were also excluded. Furthermore, cases with a history of smoking, hookah use, or alcohol consumption were not included in this study to eliminate potential confounding factors affecting metabolic and glycemic outcomes.
Glycemic parameters: FBG, HbA1c were detected by routine lab work, insulin was detected by ELISA, insulin sensitivity and HOMA-IR were estimated according to Minh et al. [18].
DNA extraction and target SNPs: whole genomic DNA was isolated from blood samples using the Favorgen Blood Genomic DNA Extraction Kit (Favorgen Biotech Corp., Taiwan) according to the protocol. Specific primer sets were designed to amplify the flanking regions of six Single-Nucleotide Polymorphisms (SNPs): rs553096515, rs566505112, rs535426224, rs557659793, rs183037055, and rs540311235. These SNPs were selected based on data from the NCBI database due to their potential involvement in gene variation related to glycemic control. PCR amplification was achieved by standard conditions, with an annealing temperature of 58 °C. The amplified products were subsequently purified and sequenced by Macrogen Inc. (South Korea) for genotype confirmation.
Statistical analysis: Data were reported as mean ± SE. The independent-samples t-test was used to detect differences in continuous variables between study groups, while the Chi-square test was used for categorical variables. Odds ratios (ORs) with 95% confidence intervals (CI95%) were used to evaluate associations between genotypes and GC status. Genotypic and allelic distributions were detected using MEGA11. Linkage disequilibrium (LD) and SNP-SNP interaction analyses were conducted based on established bioinformatics tools and methodologies [19-22]
3. RESULTS
In this study, samples were categorized according to glycemic control: approximately 55% of subjects had poor GC, while 45% had good GC. No significant differences were observed in sex distribution (p = 0.521) (Table 1).
| Study Variables | Good GC | Poor Glycemic Control | p |
|---|---|---|---|
| Percentage % | 54(45%) | 66(55%) | - |
| Sex | - | - | - |
| Male | 19 (35.18%) | 27 (40.90%) | 0.5210 |
| Female | 35(64.81%) | 39(59.09%) |
| Biomarkers | Good GC | Poor Glycemic Control | p |
|---|---|---|---|
| Age (year) | 54.31±1.341 | 53.69±1.130 | 0.723 |
| BMI (Kg/m2) | 27.94±0.506 | 29.161±1.413 | 0.456 |
| Duration of disease (year) | 6.76±0.795 | 7.734±0.689 | 0.355 |
| FBG | 174.20±9.176 | 256.50±12.453 | 0.000 |
| HbA1c % | 7.76±1.141 | 10.47±0.251 | 0.012 |
| Insulin | 8.82±1.684 | 8.55±1.469 | 0.905 |
| HOMA-IR | 67.72±13.309 | 98.702±18.83 | 0.200 |
| Insulin sensitivity | 1.127±0.068 | 1.163±0.045 | 0.652 |
The Comparison between study groups found significant differences in key glycemic markers. FBG levels were significantly elevated in the poor GC group (256.50 ± 12.45 mg/dL) compared to the GC group (174.20 ± 9.18 mg/dL) (p = 0.000). Same result for HbA1c levels: significantly higher in cases with poor GC (10.47 ± 0.25%) than in those with good GC (7.76 ± 1.14%) (p = 0.012). In contrast, other parameters did not report significant changes between the groups (p > 0.05). These outputs indicate that while demographic and insulin-related factors were comparable, glycemic parameters such as FBG and HbA1c serve as reliable indicators distinguishing glycemic control status in cases with T2DM (Table 2).
In the current work, we found that 59.61% of study subjects had a deletion mutation; in poor GC, the deletion mutation was 54.92%, and in good GC, it was 45.07%, with no statistically significant difference (χ2 = 0.7413, p = 0.389). About six SNPs were analyzed in the present study, including rs553096515, rs566505112, rs535426224, rs557659793, rs183037055, and rs540311235, which have been reported in genome projects in the NCBI database. The present findings identified a new allele (G) in rs553096515 (C > A,T), allele (T) in rs566505112 (C > A, G), and allele (G) in rs535426224 (C > T) (Fig. 1).
The allele frequencies of the present study are clarified in Table 3. No statistically significant associations were observed across all SNP alleles; slight differences in SNP allele frequencies were observed between study groups.
The genotypes of study SNPs in groups showed no statistically significant associations of all genotypes (Table 4).
| SNPs | X2 | p | OR [95% CI] | Allele Frequency |
|---|---|---|---|---|
| rs553096515 | 0.346 | 0.556 | 0.787 [0.354~1.747] | C G Poor GC 29(0.58) 21(0.42) Good GC 25(0.52) 23(0.479) |
| rs566505112 | 0.033 | 0.855 | 0.928 [0.418~2.059] | C T Poor GC 28(0.56) 22(0.44) Good GC 26(0.541) 22(0.458) |
| rs535426224 | 0.03 | 0.861 | 0.931 [0.418~2.072] | C G Poor GC 29(0.58) 21(0.42) Good GC 27(0.562) 21(0.437) |
| rs557659793 | 0.054 | 0.815 | 1.1 [0.493~2.449] | C T Poor GC 22(0.44) 28(0.56) Good GC 20(0.416) 28(0.583) |
| rs183037055 | 1.052 | 0.304 | NA [NA~NA] | C G Poor GC 50(1) 0(0) Good GC 47(0.979) 1(0.02) |
| rs540311235 | 0.02 | 0.887 | 0.942 [0.417~2.129] | C T Poor GC 28(0.56) 22(0.44) Good GC 24(0.545) 20(0.454) |
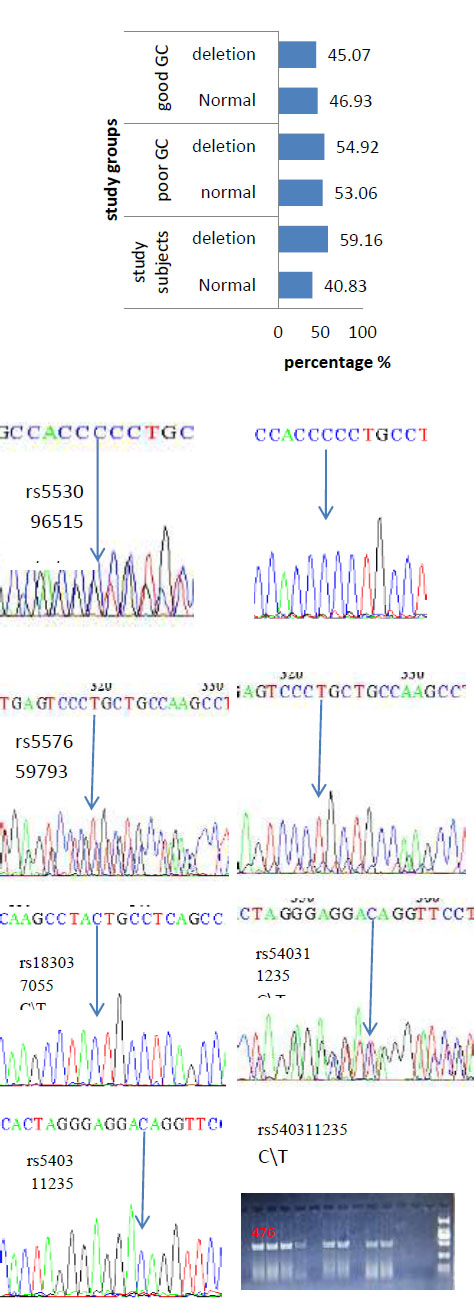
The percentage of deletion mutation in study subjects and groups; PCR products of target sequences clarified the deletion mutation (empty wells) and the normal (476 bp); and histograms of new alleles in (G) rs553096515 C > A, T. rs566505112 C > A, G, and in rs535426224 C > T in study subjects.
| SNP | X2 | p | Genotypes |
|---|---|---|---|
| rs553096515 | 1.871 | 0.171 | C/G C/C Poor GC 21(0.84) 4(0.16) Good GC 23(0.958) 1(0.041) |
| rs566505112 | 0.179 | 0.671 | C/T C/C Poor GC 22(0.88) 3(0.12) Good GC 22(0.916) 2(0.083) |
| rs535426224 | 0.122 | 0.726 | C/G C/C Poor GC 21(0.84) 4(0.16) Good GC 21(0.875) 3(0.125) |
| rs557659793 | 0.217 | 0.64 | C/T T/T Poor GC 22(0.88) 3(0.12) Good GC 20(0.833) 4(0.166) |
| rs183037055 | 1.063 | 0.302 | C/C C/G Poor GC 25(1) 0(0) Good GC 23(0.958) 1(0.041) |
| rs540311235 | 0.104 | 0.746 | C/T C/C Poor GC 22(0.88) 3(0.12) Good GC 20(0.909) 2(0.09) |
| SNP | X2 in PoorGC | p in Poor GC | X2 in Good GC | p in Good GC | X2 in Both | p in Both |
|---|---|---|---|---|---|---|
| rs553096515 | 8.699 | 0.003 | 14.803 | 1.19e-04 | 22.654 | 1.94e-06 |
| rs566505112 | 10.593 | 0.001 | 12.141 | 4.93e-04 | 22.654 | 1.94e-06 |
| rs535426224 | 8.699 | 0.003 | 9.924 | 0.001 | 18.562 | 1.64e-05 |
| rs557659793 | 10.593 | 0.001 | 8.078 | 0.004 | 18.562 | 1.64e-05 |
| rs183037055 | 0 | 1 | 4.48e-04 | 0.983 | 1.06e-04 | 0.991 |
| rs540311235 | 10.593 | 0.001 | 10.732 | 0.001 | 21.278 | 3.97e-06 |
The allele frequencies according to Hardy-Weinberg are clarified in Table 5. Significant associations were reported for almost all SNPs in the good, poor, and both groups. For the majority of the SNPs evaluated (rs553096515, rs566505112, rs535426224, rs557659793, and rs540311235), rs553096515 showed significant deviation in the poor glycemic control group (X2 = 8.699, p = 0.003), the good GC group (X2 = 14.803, p = 1.19 × 10^-4), and in the combined group (X2 = 22.654, p = 1.94 × 10^-6). Similar consistent deviations were observed for rs566505112 (p≤0.001 in all comparisons), rs535426224, rs557659793, and rs540311235. While rs183037055 did not show any deviation from HWE in any subgroup or in the combined dataset, indicating that the genotype frequencies for this SNP were in equilibrium and consistent with expectations. The observed deviations for the other SNPs may indicate underlying biological factors, such as selection pressures, or methodological factors, including potential genotyping errors or population stratification. These findings suggest that caution should be exercised when interpreting relation results for SNPs that are not in HWE (Table 5).
Pairwise SNP interaction analysis was conducted in both study groups. Across all SNP pairs, the interaction coefficients were generally negative, indicating potential non-synergistic effects. However, none of the interactions reached statistical significance in either group. The strongest interaction impact was found between rs566505112 and rs557659793 in the poor GC group (interaction coefficient = -0.366), but the difference between this and the corresponding value in the good GC group (-0.171) was not statistically significant (p = 0.265), the interaction between rs553096515 and rs557659793 also showed a relatively higher negative interaction in the poor GC (-0.276 vs. -0.079 in the good group), but this difference was not significant. The interaction coefficients involving rs183037055 were close to zero in both groups, indicating little to no interaction effect with the other SNPs. The differences in interaction values between groups ranged from -0.197 to +0.007, none of which reached statistical significance. These findings suggest that there is no statistically significant interaction among the analyzed SNPs of SLC47A2 in relation to GC status in T2DM patients (Table 6).
Haplotype analysis was performed for rs553096515, rs566505112, rs535426224, rs557659793, rs183037055, and rs540311235; the results identified four haplotypes with no statistically significant associations (Table 7).
The linkage disequilibrium among SNPs was calculated for study subjects, good and poor GC groups. The global results analysis showed (X2 is 4.556, p is 0.207) for study subjects, (X2 is 4.079, p is 0.252) for poor GC, and (X2 is 0.045, p is 0.977) for good glycemic control.
| SNP set | Poor GC Interaction | Good GC Interaction | diff | p |
|---|---|---|---|---|
| rs553096515,rs566505112 | -0.276 | -0.115 | -0.161 | 0.436 |
| rs553096515,rs535426224 | -0.188 | -0.093 | -0.095 | 0.539 |
| rs553096515,rs557659793 | -0.276 | -0.079 | -0.197 | 0.152 |
| rs553096515,rs183037055 | 0 | -0.001 | 0.001 | 0.687 |
| rs553096515,rs540311235 | -0.276 | -0.121 | -0.155 | 0.534 |
| rs566505112,rs535426224 | -0.276 | -0.207 | -0.069 | 0.623 |
| rs566505112,rs557659793 | -0.366 | -0.171 | -0.195 | 0.265 |
| rs566505112,rs183037055 | 0 | -0.003 | 0.003 | 0.439 |
| rs566505112,rs540311235 | -0.366 | -0.304 | -0.062 | 0.76 |
| rs535426224,rs557659793 | -0.276 | -0.283 | 0.006 | 0.932 |
| rs535426224,rs183037055 | 0 | -0.005 | 0.005 | 0.497 |
| rs535426224,rs540311235 | -0.276 | -0.217 | -0.059 | 0.939 |
| rs557659793,rs183037055 | 0 | -0.007 | 0.007 | 0.296 |
| rs557659793,rs540311235 | -0.366 | -0.178 | -0.188 | 0.362 |
| rs183037055,rs540311235 | 0 | -0.004 | 0.004 | 0.312 |
| Haplotype | Poor GC (freq) | Good GC (freq) | X2 | p | OR [95% CI] |
|---|---|---|---|---|---|
| CTGTCT | 20(0.4) | 18(0.409) | 0.064 | 0.799 | 1.111 [0.492~2.506] |
| GCCCCC | 21(0.42) | 18(0.409) | 0.206 | 0.649 | 1.206 [0.536~2.714] |
| GCCTCC | 0(0) | 3(0.068) | 3.223 | 0.072 | NA [NA~NA] |
| CCCTCC | 7(0.14) | 3(0.068) | 1.605 | 0.205 | 2.441 [0.592~10.058] |
The LD analysis, among rs553096515, rs566505112, rs535426224, rs557659793, rs183037055, and rs540311235 in study subjects, showed a strong association among some SNPs, like rs557659793 with rs553096515, rs566505112, and rs535426224 (r2 0.84-0.91), while others were not, like rs183037055 with other SNPs (r2 0.0-0.01), suggesting its independent segregation. in poor GC group, strong association among rs553096515, rs566505112, rs535426224 (r2 = 0.84- 0.92) while rs183037055 did not have an association with other SNPs (r2 = 0), in good G C group rs553096515, rs566505112, rs535426224 (r2 = 0.84- 0.91) and rs540311235 with rs553096515, rs566505112, rs535426224 (r2 = 0.9-1-1) (Fig. 2). These findings are visualized in Fig. (2). Overall, only minor LD differences were detected between the good and poor GC groups.
4. DISCUSSION
In T2DM patients, poor GC may lead to various macrovascular and microvascular complications [23]. Therefore, it is necessary to identify the factors influencing GC to achieve better outcomes. In the present study, we focused on SLC47A2, which has been implicated in GC by several studies [24, 25]. This protein functions primarily as an efflux transporter of organic cations produced in the kidney. Variants of this gene have been found to affect the pharmacokinetics of different treatments, such as metformin, which is widely used in the management of T2DM [24].
In the present study, significant elevations in FBG and HbA1c were observed in patients with poor GC. This is attributed to multiple factors, including lifestyle, physical activity, diet, and genetic factors. SLC47A2 polymorphisms represent one of the genetic factors that influence drug metabolism and help maintain blood sugar levels.
The current finding indicate not statistically significant association of SLC47A2 gene variation with GC in all SNPs rs553096515, rs566505112, rs535426224, rs557659793, rs183037055 and rs540311235 in all genetic tests, single locus association, genotyping, haplotypes, SNPs interaction and LD tests, Chen et al., found that SLC47A2 gene variation might impact the risk of DM2 by HOMA-IR and other factors parameters changing [26]. Their results differ from the present study, as they found that SLC47A2 rs12943590 may be a risk factor for HOMA-IR in T2DM. The effect of SLC47A2 on DM is primarily related to its role in drug metabolism, particularly metformin [24]. SLC47A2 gene polymorphisms can help predict favorable responses to metformin treatment in Mexican populations. Additionally, non-variant regions of SLC47A2 contribute to protein function, and one study suggested that common promoter haplotypes of SLC47A2, comprising nine variants in the promoter sequence, are associated with metformin pharmacokinetics [27].
Furthermore, the findings of Stocker et al. suggested that MATE1 and MATE2 promoter variants are significant determinants of metformin disposition and response in healthy volunteers and DM patients [28].
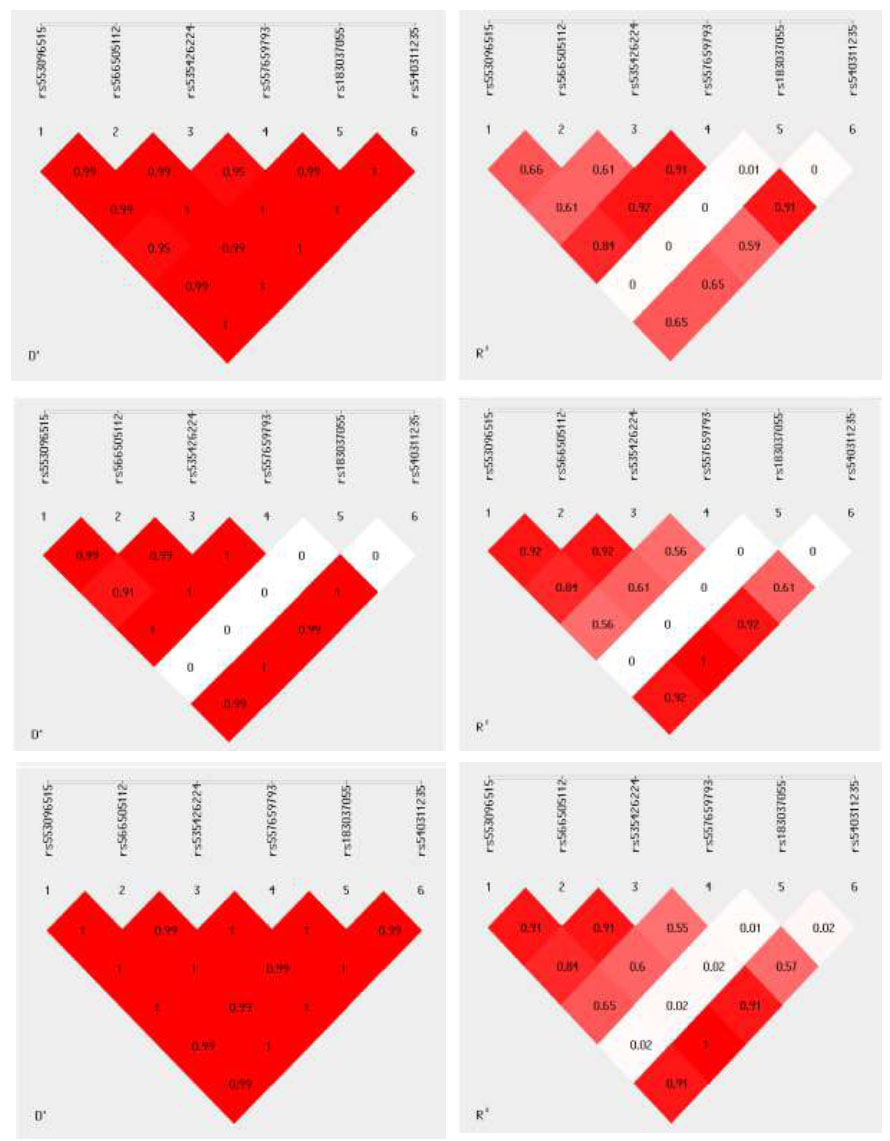
The linkage disequilibrium among (D and R values) rs553096515, rs566505112, rs535426224, rs557659793, rs183037055, and rs540311235 in study subjects (upper), poor GC (middle), and good GC group (lower).
In the Iraqi population, multiple factors influence GC, and other studies have reported partial agreement with these results [29-31]. In the present study, deletion mutations and new alleles were identified in DM subjects, including (G) in rs553096515 (C>A,T), (T) in rs566505112 (C>A,G), and (G) in rs535426224 (C>T), as well as deletion mutations. These variations, along with other factors such as drug combinations [29], oxidative stress, and DNA repair system efficiency, may contribute to GC in DM when compared with healthy individuals [32-35].
SLC47A2 genetic variation, which encodes the MATE2 transporter, plays an important role in modulating glycemic control in T2DM patients receiving metformin therapy. MATE2 is responsible for secreting metformin into the urine via renal tubular cells, working in coordination with SLC22A2 and SLC47A1 to transport the drug out of the body [36].
A SLC47A2 promoter variant has been observed to be associated with altered insulin resistance response to metformin, with greater reductions in HOMA-IR in Han Chinese T2DM patients receiving metformin monotherapy, which partially agrees with these findings [26].
CONCLUSION
This study elucidated that over half of the cases exhibited poor GC, which represented big health problems among Iraqi individuals who used a single dose of metformin, with significant differences in FBG and HbA1c% levels between glycemic control groups. Novel alleles were identified in three SNPs; however, allele and genotype frequencies in all six SNPs showed no significant correlation with GC status. While no significant SNP interactions or haplotypes were associated with GC, linkage disequilibrium analysis demonstrated strong associations among rs553096515, rs566505112, and rs535426224 in both groups and across all participants. Deviations from HWE in some SNPs suggest potential genetic or population-specific influences that warrant further investigation. In the future, the authors may be able to explore whether multiple transporter gene combinations can be used or whether expanding the research sample size can reveal a more subtle effect of type 2.
AUTHORS’ CONTRIBUTIONS
The authors confirm their contribution to the paper as follows: M.J.A.J.: Study conception and design; R.N.H.: Analysis and interpretation of results; M.N.A.T.: Writing the paper. All authors reviewed the results and approved the final version of the manuscript.
LIST OF ABBREVIATIONS
| T2DM | = Type 2 Diabetes Mellitus |
| GC | = Glycemic Control |
| FBG | = Fasting Blood Glucose |
| HbA1c | = Glycated Hemoglobin |
| HOMA-IR | = Homeostatic Model Assessment for Insulin Resistance |
| SNP | = Single Nucleotide Polymorphism |
| LD | = Linkage Disequilibrium |
| HWE | = Hardy–Weinberg Equilibrium |
| PCR | = Polymerase Chain Reaction |
| DNA | = Deoxyribonucleic Acid |
| BMI | = Body Mass Index |
| ADA | = American Diabetes Association |
| OR | = Odds Ratio |
| CI | = Confidence Interval |
| MATE2 | = Multidrug and Toxin Extrusion Protein 2 |
| SLC47A2 | = Solute Carrier Family 47 Member 2 |
ETHICS APPROVAL AND CONSENT TO PARTICIPATE
Ethical approval from the Ministry of Higher Education and Scientific Research in Iraq through the Institutional Review Board (IRB) (Approval Code: MHE-IRB-/1/COS/2024-118).
HUMAN AND ANIMAL RIGHTS
All procedures performed in studies involving human participants were in accordance with the ethical standards of institutional and/or research committee and with the 1975 Declaration of Helsinki, as revised in 2013.